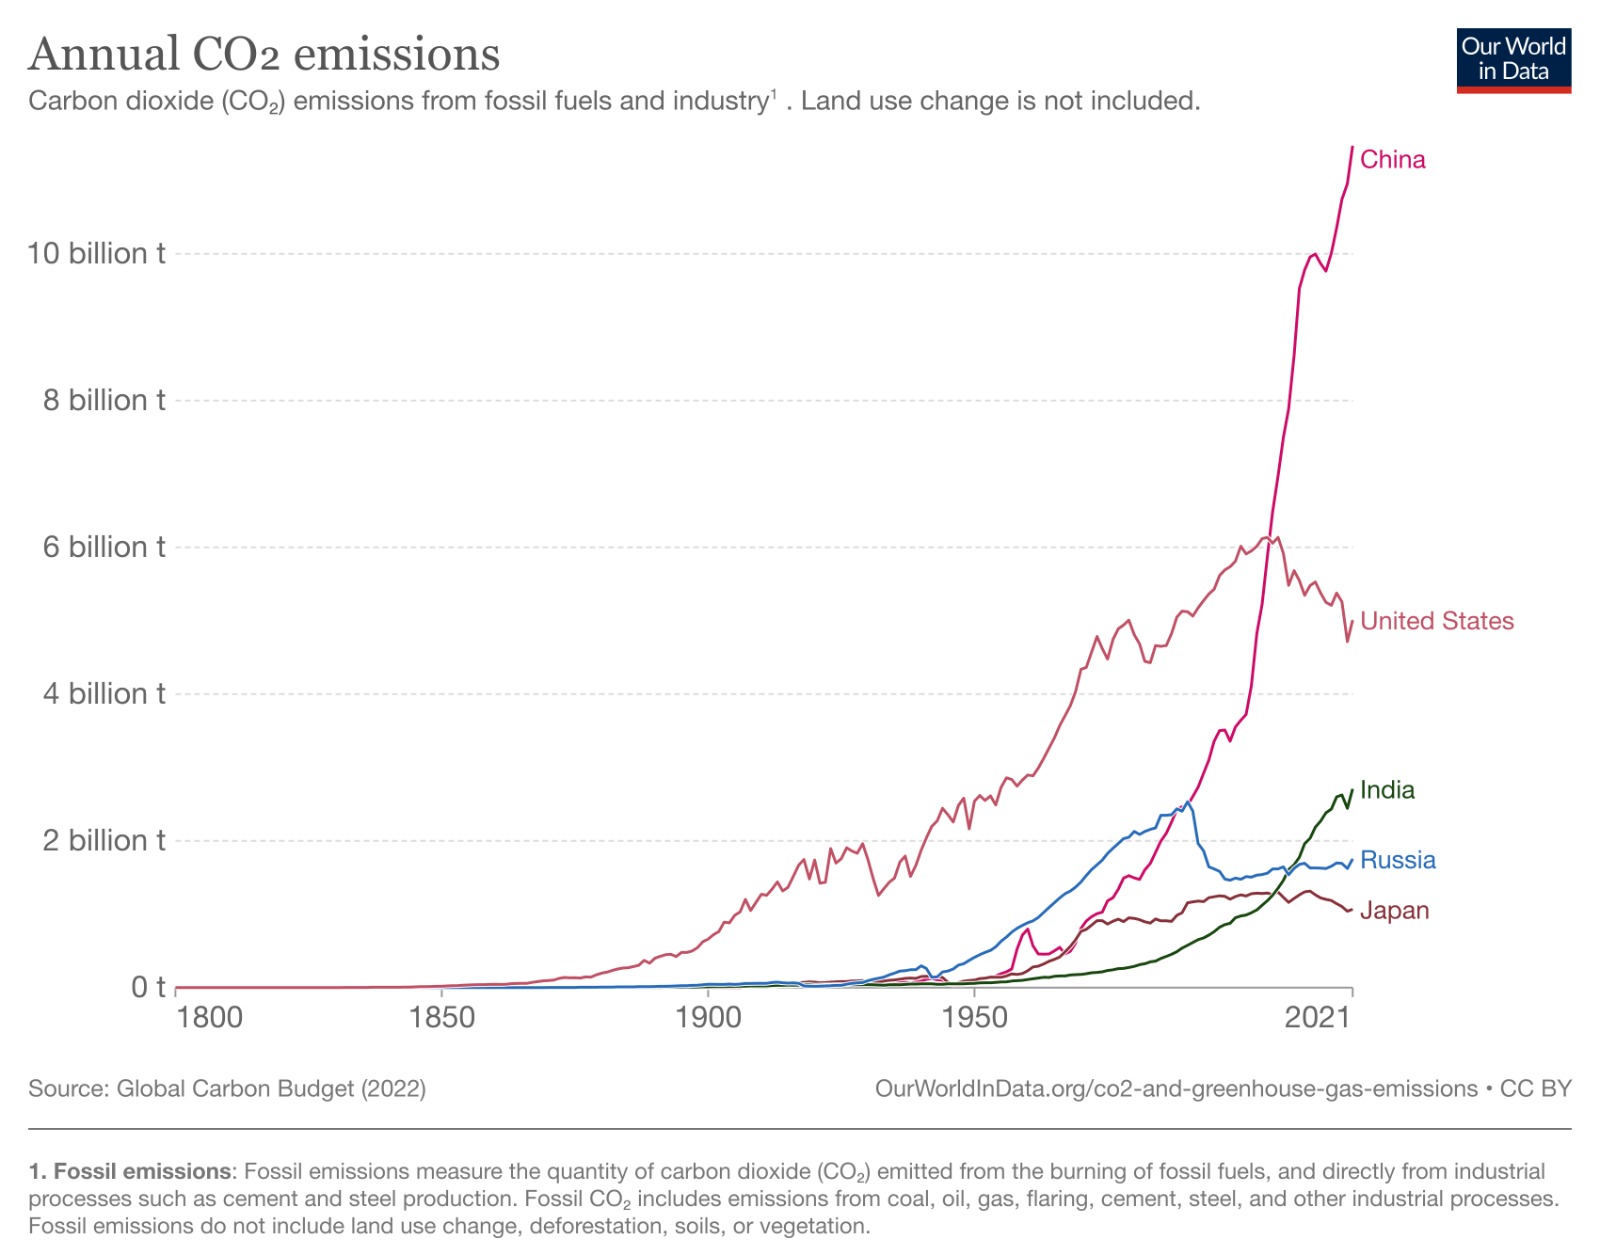
The top five emitting countries in the World currently are responsible for 59,3% of overall global emissions. In absolute levels, China leads the ranking with almost 11.5 billion tons in 2021, twice as much as the US with 5 billion tons, followed by India with half as much as the US at 2.7 billion tons, then Russia and Japan with 1.8 and 1.1 billion tons respectively. Figure 1 below shows the historical projections in the annual CO2 emissions levels for the top 5 emitting countries.
Figure 1: Historical annual levels in GHG emissions for the top five emitting countries.
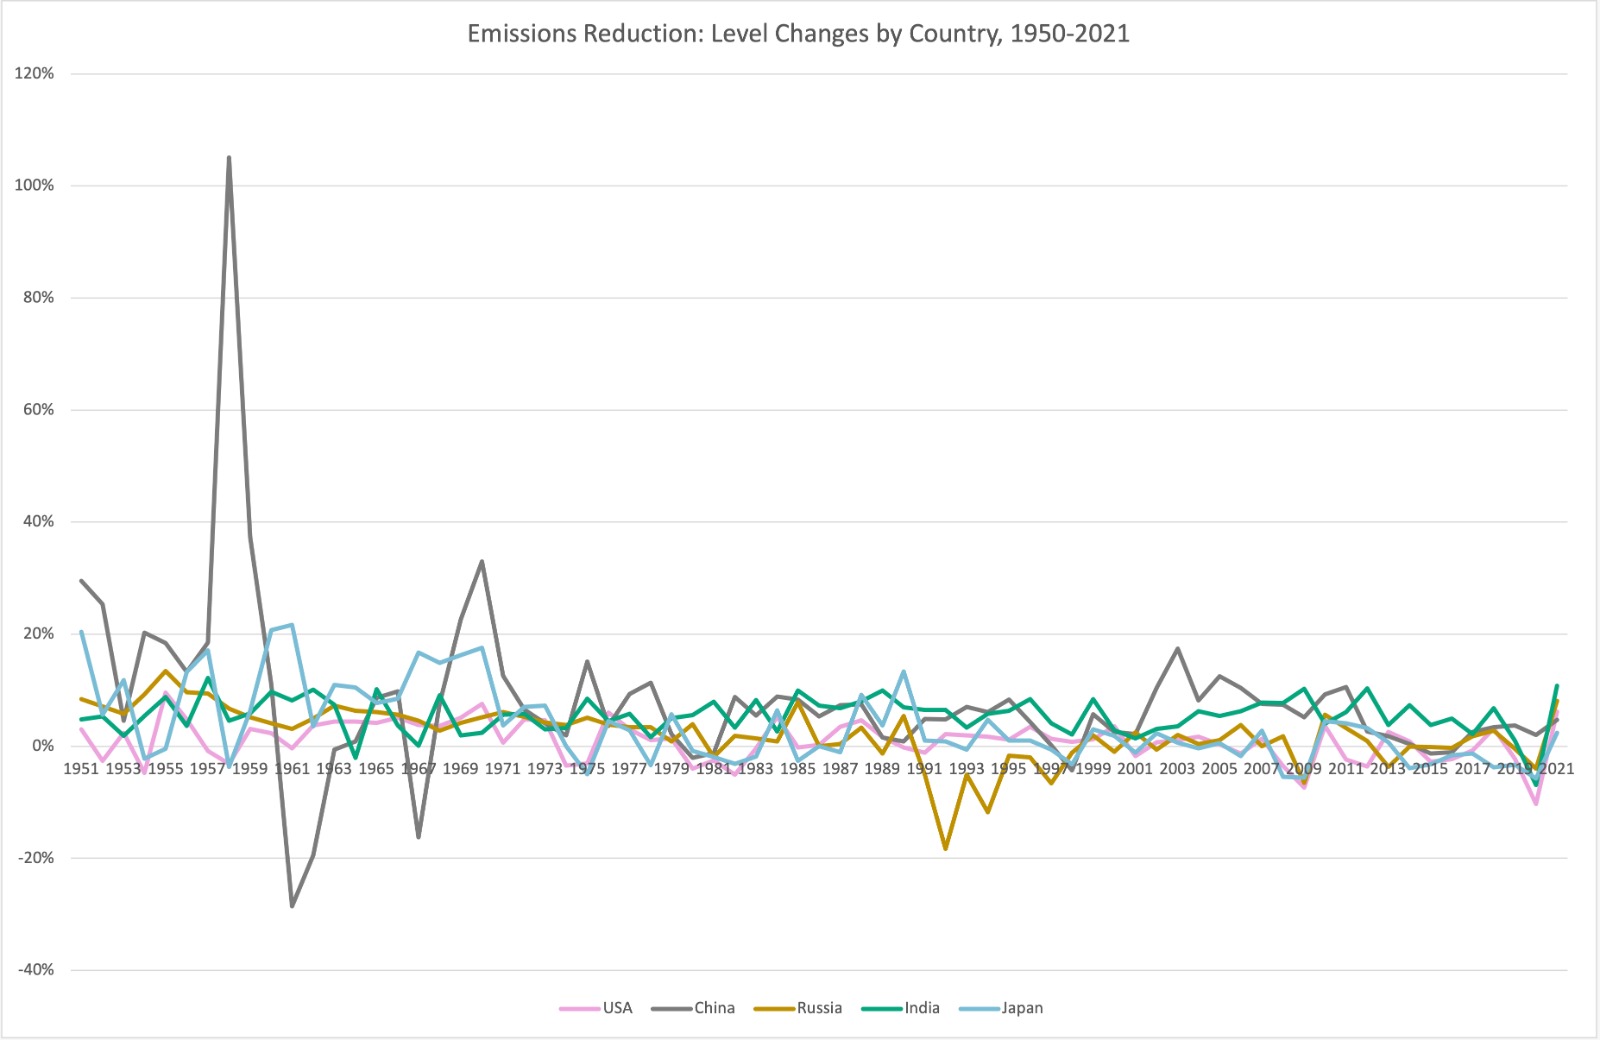
The most recent revisions to emission projections are showing that even if all countries meet their emissions targets, the World is still on the path to experiencing an increase by 2.1 degrees celsius in global temperatures. To bring clarity, on which of the top five emitting countries are on the path to meeting targets, we apply our proprietary Nova Scoring model. Following the model, we assess the progress that each of the five countries listed above are making to reduce their overall emissions. To build the Nova Emissions Score, for each of the countries, we first compute the historical level changes in emissions, since the 1950s. The results are as shown in Figure 2 below.
Figure 2: The historical annual level changes in GHG emissions for the top five emitting countries.
What stands out is that although, all countries have reduced the fluctuations in their emissions levels over time, still all the level changes still appear to be in positive territory, which is indicative of two key conclusions:
- All the top five global emitting countries do indeed have proper agendas in place to reduce and control their GHG emissions.
- Regardless, none of the countries seems to be on the net-zero path yet, that is, none of the countries has realized more than a few consecutive years of negative changes in their emissions levels in the last 71 years.
In terms of reduction trends, the US seems to be continuing on a flat downward trajectory since the late 1980s, whereas China has reversed back to an increasing trajectory, which breaks its steady decade-long downward trend in emission changes that lasted from the early 2000s up to around 2015. Russia also demonstrates a trend reversal from its 7-year negative growth streak in the post-communist era, back to positive growth rates in the 2000s onwards.
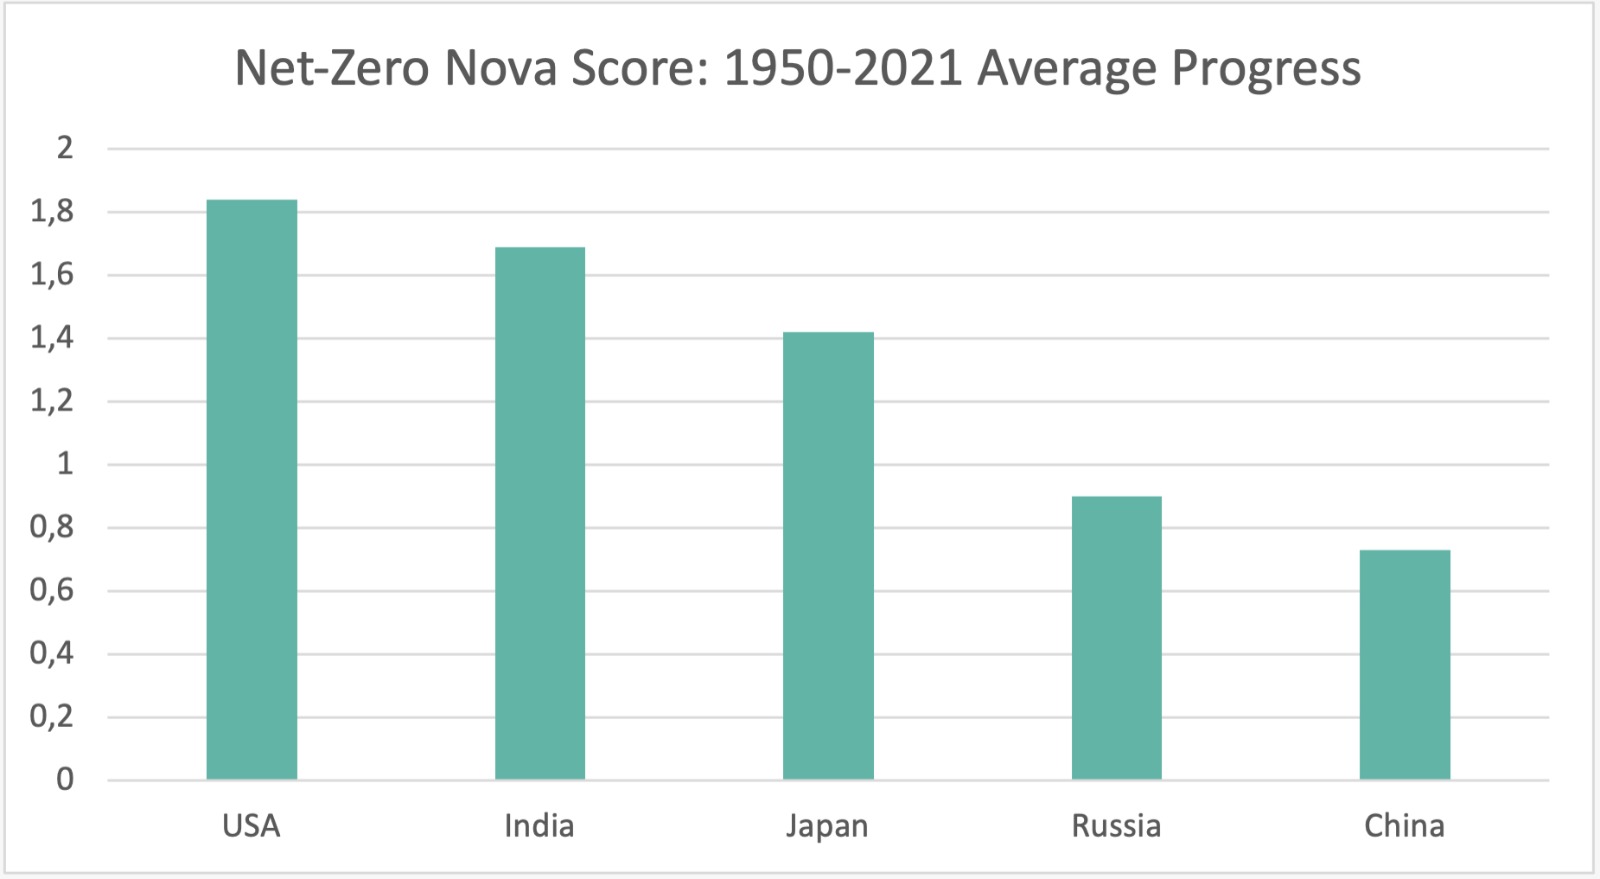
Figure 3 shows the 19650-2021 average Nova scores that we have computed using our proprietary model. The Nova Scores for each country are built using the level changes in a country’s emissions over time and as such they reflect real positive progress that each country is showing to control emissions and meet their global pledges. A high average Nova score, reflects the most progressive country to meeting its net-zero target and a low average Nova score, helps to identify the countries whose actions are falling behind in meeting their targets. As the figure below demonstrates, the country whose real progress has been on average most aligned with its net-zero targets in the last 71 years is the US, followed by India, Japan, Russia and lastly China.
Figure 3: Net-Zero Nova Scores for top five emitting countries. The 1950-2021 average.
Figure 3 results have important implications for many stakeholders, including insurance companies, real estate investment firms, businesses and even governments. The most trivially known macro consequence of uncurbed emissions is the rise in temperature levels, which causes fires, droughts, floods, hurricanes etc, depending on the area. As such, the return numbers of insurance companies and real estate investors are largely dependent on the actions that each country is taking to reduce its emissions. The Nova Score, which reflects the true historical progress of a country to meet targets, offers a progressive risk assessment for insurance and real estate investors, as compared to the classic ESG risk scores, which in turn only reflects targets and the success at managing ESG “still to be agreed” global standard indicators.
Additionally, the profits and the productivity of businesses in sectors like agriculture, depend on the respective country’s net-zero progress. Similarly, governments can benefit from green financing options, where ESG is a screening criteria and lending organizations are increasing their assessment criteria to account for impact instead of targets. As such, it is crucial that governments use the Nova Score as a form of self-assessment and benchmarking, to be self-assured in passing the stricter criteria on future green projects. Additionally, a government’s budget balance is directly dependent on its spending to mitigate negative externalities due to climate change, such as putting away fires, dealing with population relocation due to droughts etc. The Nova score in this regard, is again a good proxy to estimating how affected future government budget balances will be by climate-related events, which are a result of the country’s inability to curb emissions in the first place.