ESG finance has been proclaimed for its potential to accelerate the global transition to net-zero, yet its true impact at delivering on these hyped expectations for the past two decades has been marginal, resulting in a series of reputational and financial damages and necessitating a transformation of the ESG industry overall.
The realization that such a transformation will require realistic transition data and progress assessment metrics, inspired us to develop a science-based (as opposed to the usual ad-hoc rules-based) ESG framework that can consistently assess and compare the realized progress across different industries over time. The possession of a complete history of the realized progress, can help investors avoid greenwashing and use ESG finance to accelerate the global achievement of targets.
Existing ESG scores carry a large sectoral bias, resulting in all brown companies receiving a bad score and all green companies receiving a good score. This often biases ESG portfolios to exclude all brown companies and include green companies without further due diligence on the improvement progress that each company, regardless of industry might be realizing. Knowing which companies are improving in the direction of global targets and which are failing to do so, can help investors to build future-proof and financially-sound portfolios. Additionally, financially rewarding companies for their ESG progress, can incentivise them to set and follow clearly defined agendas to reach their sustainability targets faster.
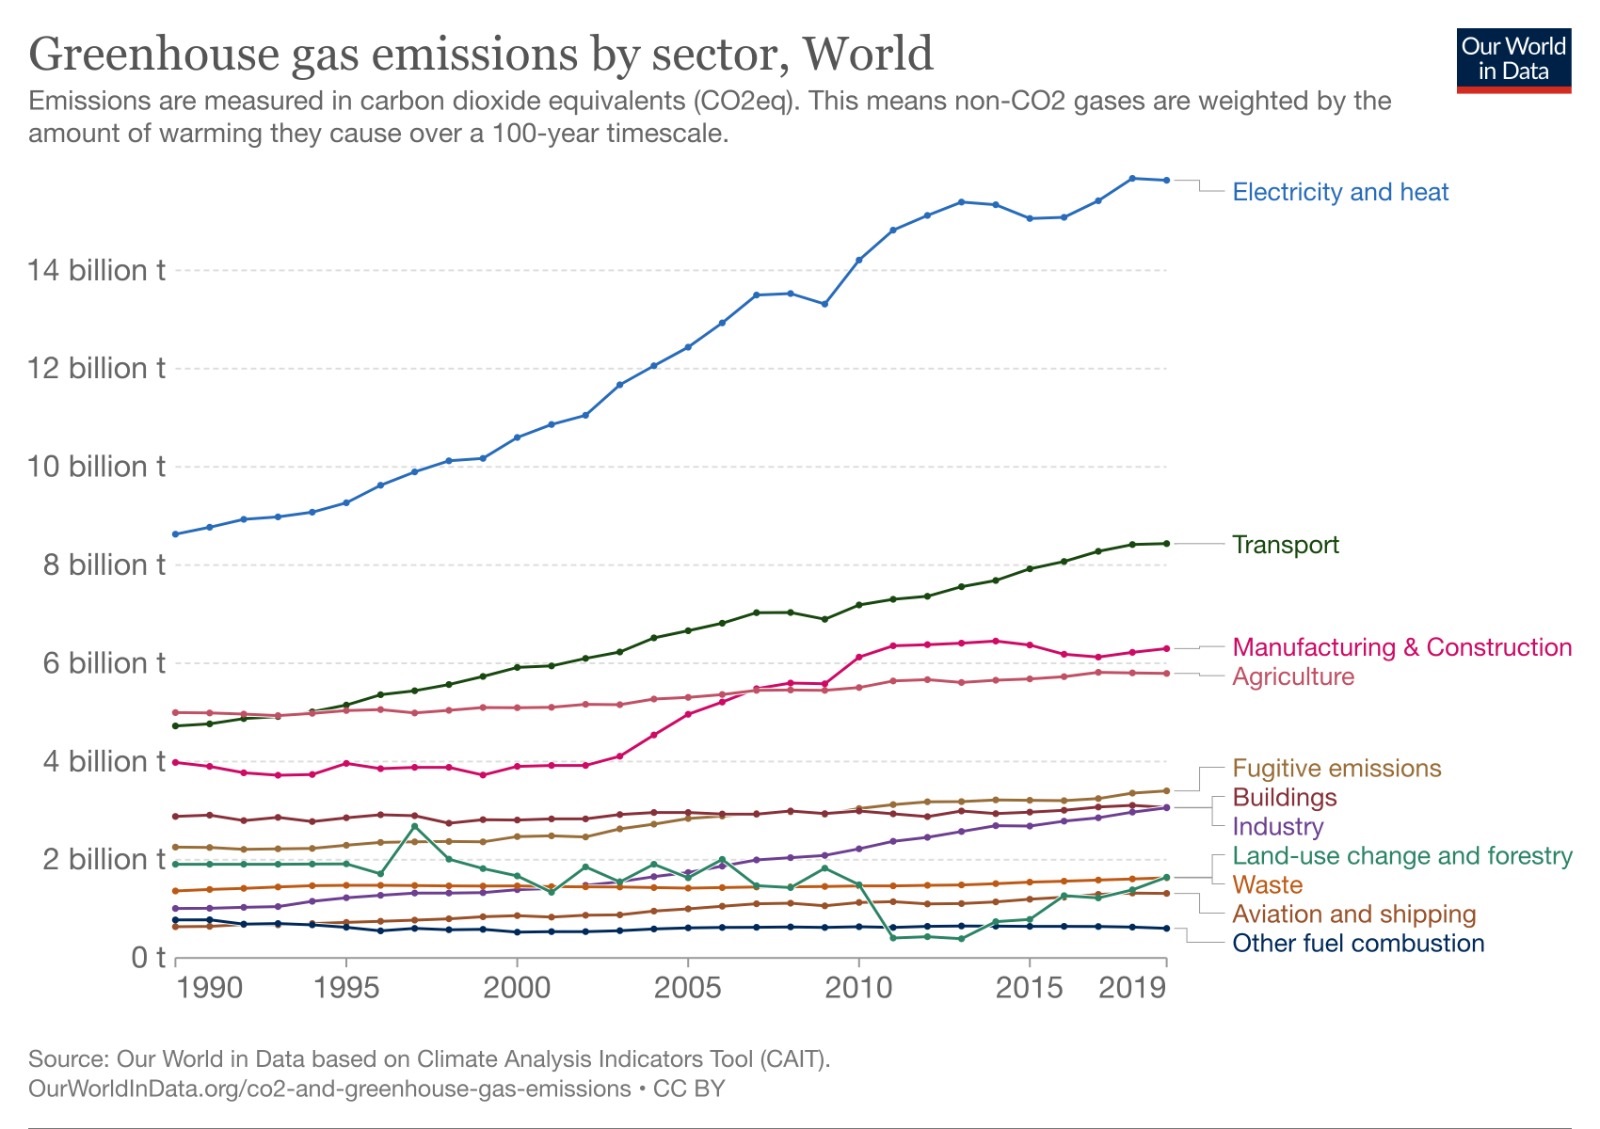
At the macro level, we show how our progress assessment framework can be used to identify true progress, even among the largest global polluters. Using data from Our World in Data, we identified the largest five polluting sectors globally are: Electricity and Heat, Transport, Manufacturing and Construction, Agriculture and Fugitive Emissions, as shown in Figure 1 below.
Figure 1: Historical levels of GHG emissions split by sectors for 1990-2019.
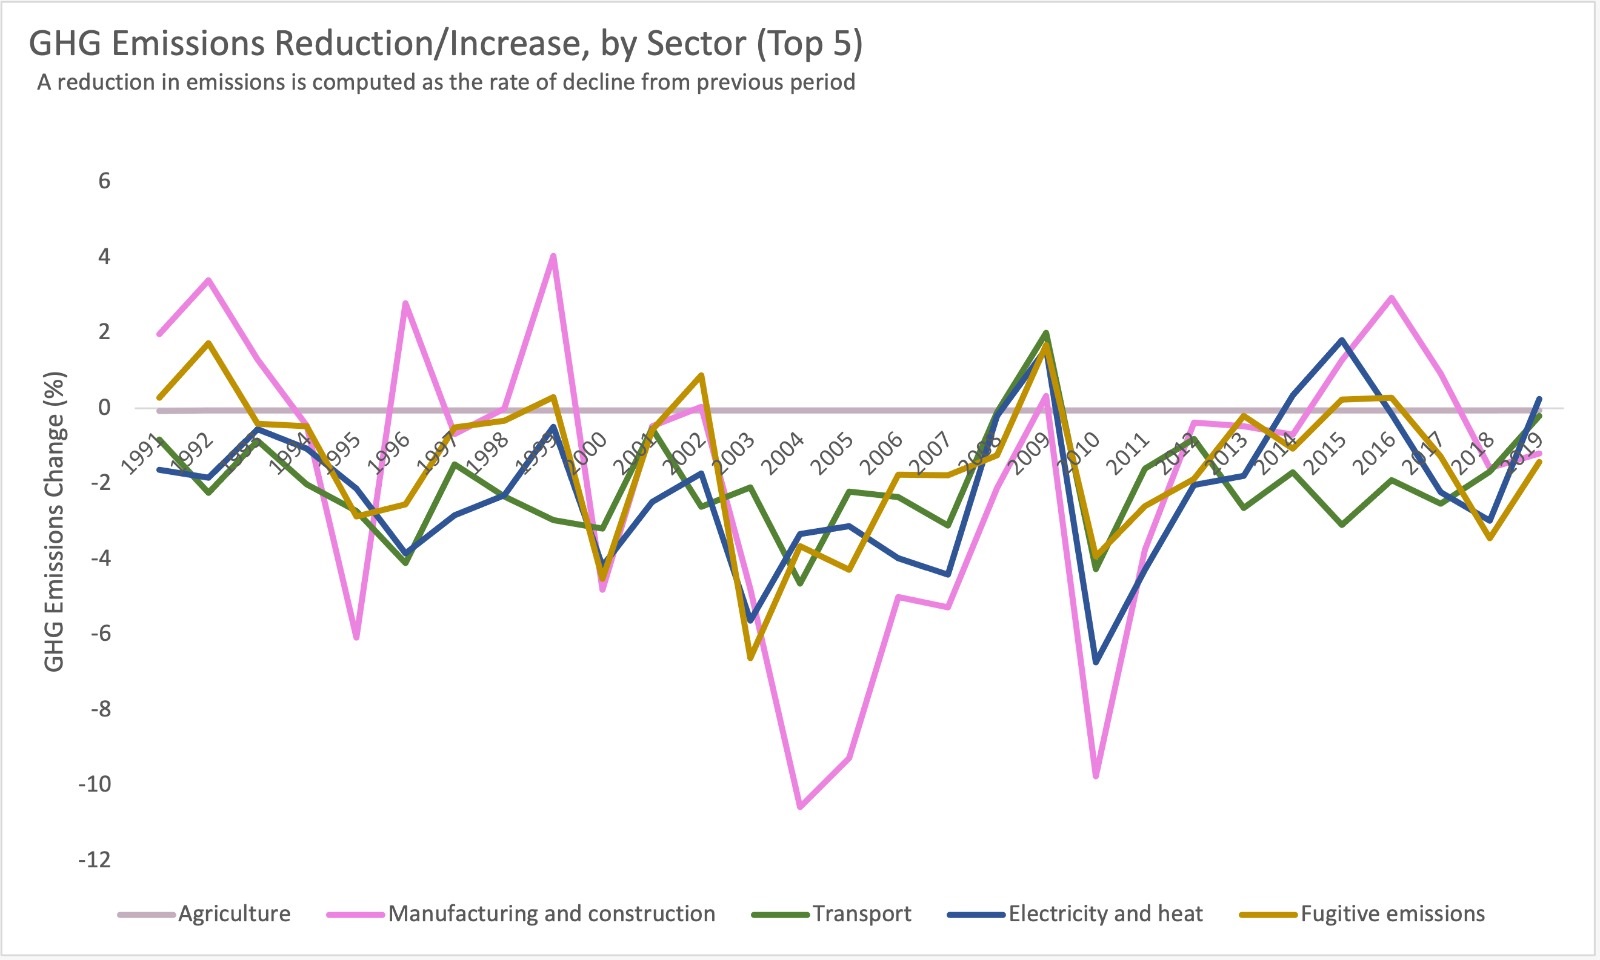
To assess progress, our methodology uses the changes in the levels of absolute emissions realized by each sector over time. Figure 2 below shows the change in emissions levels by sector for the 1990-2019 period. The large fluctuations in emissions, aside from other macro reasons, reflects the lack of a consolidated strategy by each sector towards setting and meeting net-zero targets. Regardless, some sectors seem to be on steadier emitting paths, such as Agriculture or Manufacturing and Construction and others seem to be on a steeper path to increasing their emissions, indicating large deviations from net-zero targets, such as electricity and the transport sector. To make it easy on investors or regulatory institutions to distinguish progress leaders and laggards, we developed our science-based ESG progress score.
Figure 2: Emissions reduction for the top 5 polluting sectors from 1990-2019. Positive means reduction (progress).
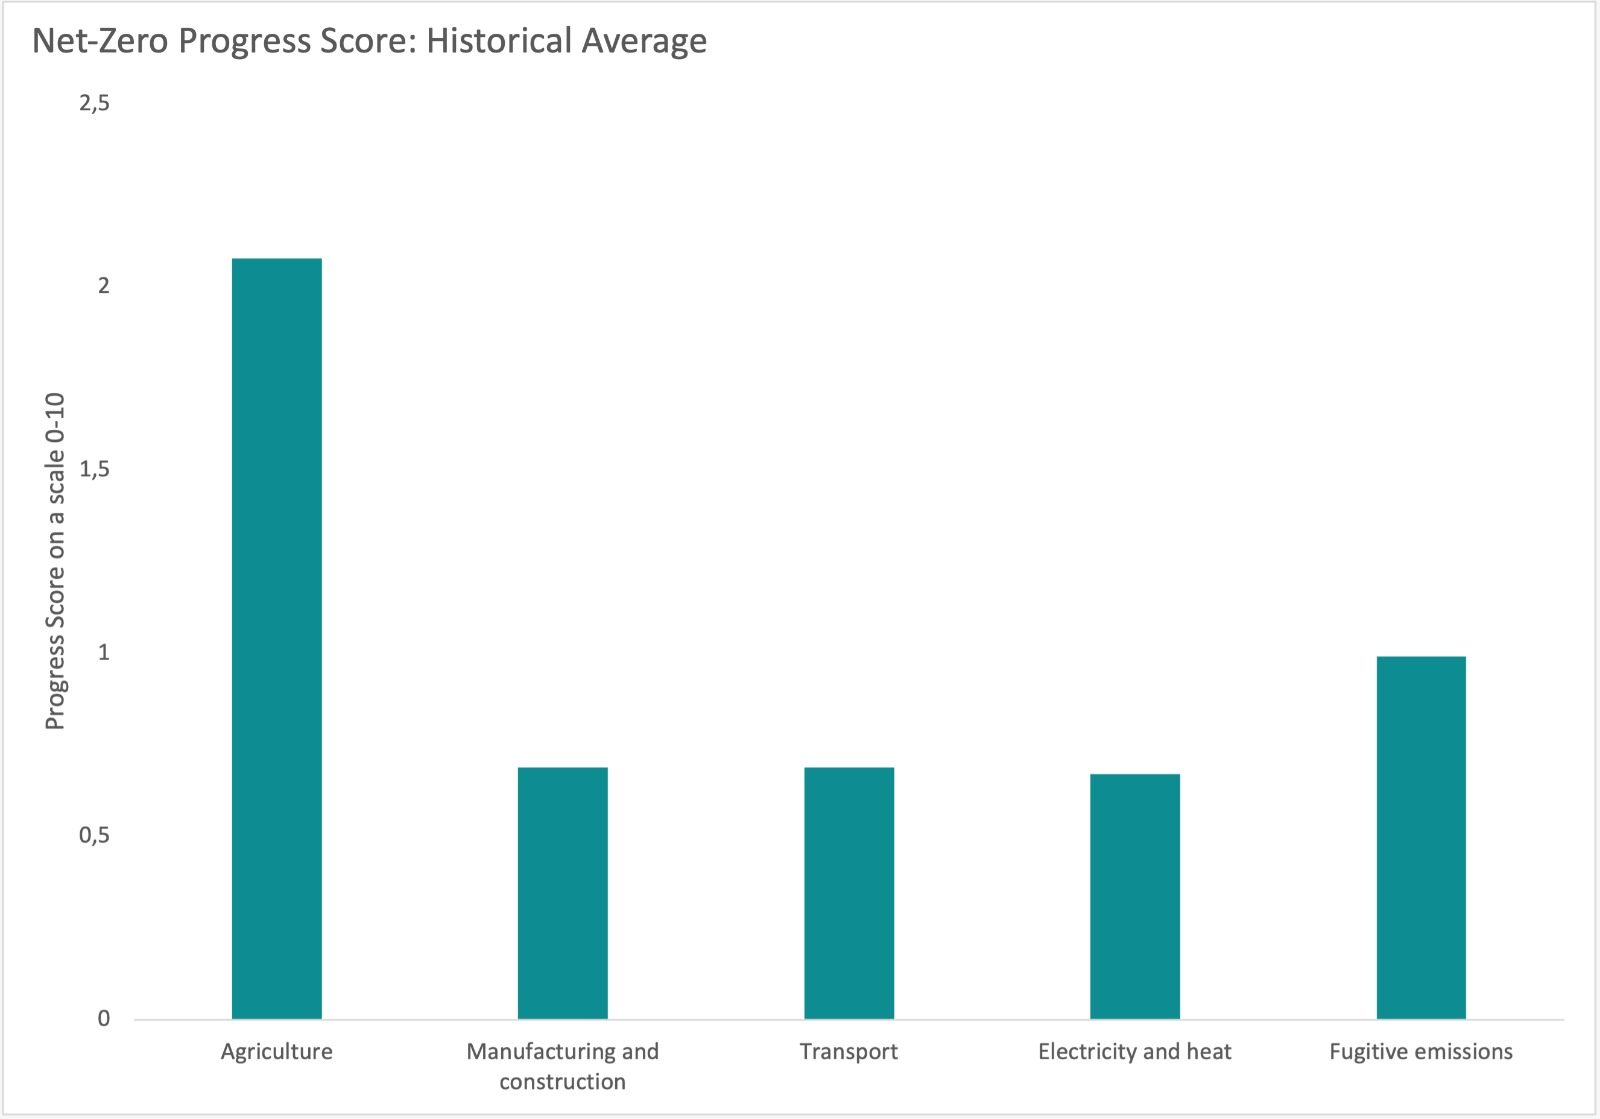
Our progress scoring methodology is built from the historical changes in emissions reduction, without including targets that are irreflective of the true improvement, such that investors and regulatory institutions can easily distinguish between progressive entities and those whose actions deviate from global goals in a transparent manner. Figure 3 below shows a historical average progress score for each of the top 5 industries above. Our progress scores, which are a pure quantitative result, can identify progress and help ESG investors protect their portfolios and reputations from greenwashing, all while pushing funds for impact. Since they reflect real improvement actions, as also indicated by the historical changes and the level slopes combined, the sector most aligned with net-zero progress out of the top 5 is agriculture, followed by fugitive emissions, manufacturing and transport and electricity last.
Identifying consistent progress matters not only from an impact but also from a financial perspective. The industry-agnostic progress scoring methodology that we just presented at the sectoral level, when applied at the company level, it can identify companies within a sub-industry that are most aligned with improvement progress on financially material ESG themes. Our studies are showing that companies with higher progress scores are correlated with higher average enterprise value. We are confident that the transparency of a purely quantitative measure such as the ConsciESG Progress score, has the potential to change SRI finance, from an industry ridden with greenwashing accusations, to one that makes data driven decisions with confidence, to deliver both better impact and higher long-term profitability.
Figure 3: The net-zero progress scores are computed using our proprietary algorithm & derived from real change components over time.