ESG funds are currently being built from scores and indices that provide binary information on a company’s involvement with brown or green business activities. Such tools are usefully applied in exclusionary ESG investment strategies. Although such scores make ESG investing easier, there is an associated financial trade-off, especially in the USA, where many states have divested from such funds, as a result of the conflict of interest that has arised from the exclusion applied in building these funds.
There are two additional controversies with using binary, aka exclusionary decision making, to align portfolios with transition targets:
- Brown sectors that get excluded are made up of the largest emitters, which should be further incentivised to decarbonize if we want to meet the global net-zero targets.
- Research has found that the brown energy sector has on average 14% more green patents than other sectors, which is indicative of real and steady actions taken to move towards the set targets.
So, we developed a solution that allows investors to build ESG portfolios, without having to exclude entire industries or sectors, by providing them with an industry-agnostic scoring system that allows them to compare the progress that companies are making to meet environmental, social and governance targets. This case focuses on emissions and builds the net-zero progress case for select companies across green & brown energy sectors.
Green Energy Producers Net-Zero Benchmarking Case
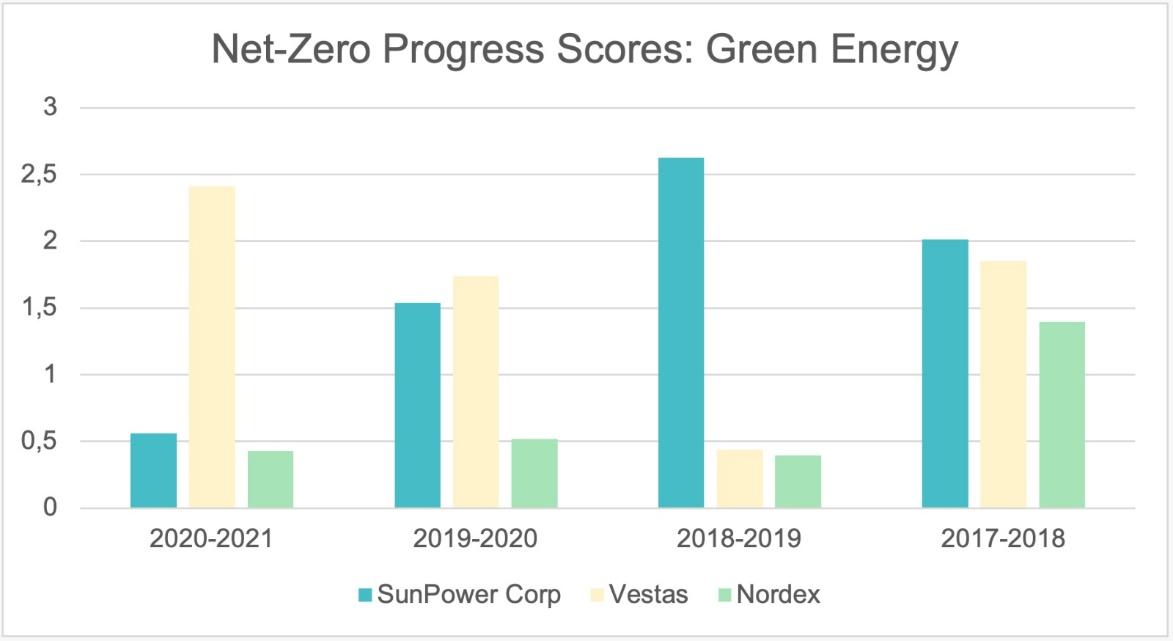
The net-zero progress score that we compute here is extrapolated from the change component that each company is realising at a given time period (i.e., 2017-2018) on each of the scope 1, 2 and 3 emission levels. Then we take the deviation from the industry average for each of the emission scopes at a given period, apply proprietary weights that we retrieve endogenously from our regression model and after a monotonic transformation that brings everything to positive numbers, we reach the values shown in the Figure 1 below.
Figure 1: Net zero progress scores for SunPower, Vestas and Nordex.
Based on our net-zero progress scores, SunPower Corp progress on reducing scope 1,2 and 3 emissions together overperforms others for the 2017-2018 and 2018-2019 period. Vestas in turn, shows significant progress over SunPower and Nordex for the 2019-2020 and 2020-2021 period. These high-level results are indicative that indeed, even within green energy producers, there is a difference between companies that do more to align their operations with net-zero and those that are slackers and lack clear agendas and clear actions.
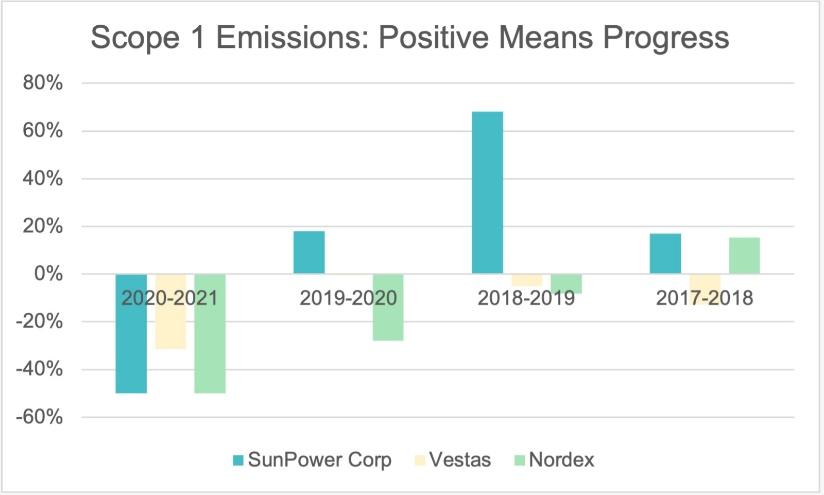
Figures 2a, b and c below go deeper into the details of scope 1, 2 and 3 emissions reduction for each company on every period. We notice controversial results such as for the period 2020-2021, where all three green companies have indeed increased scope 1 emissions, which are their direct GHG emissions coming from their own production and business operations.
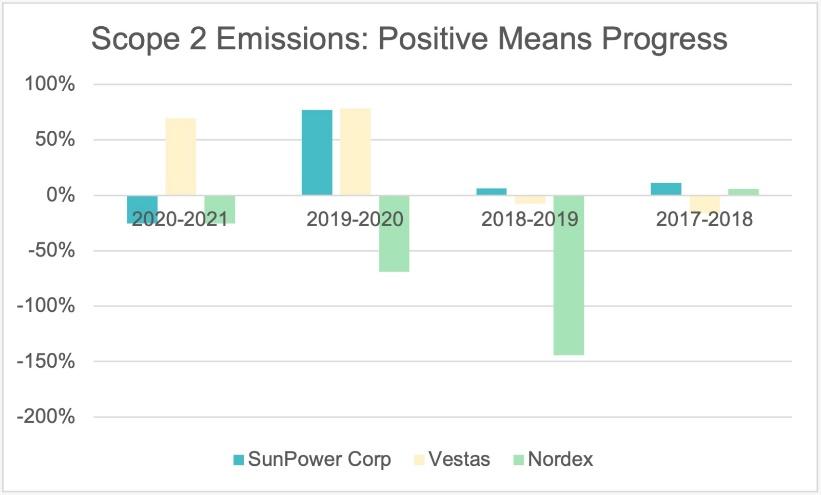
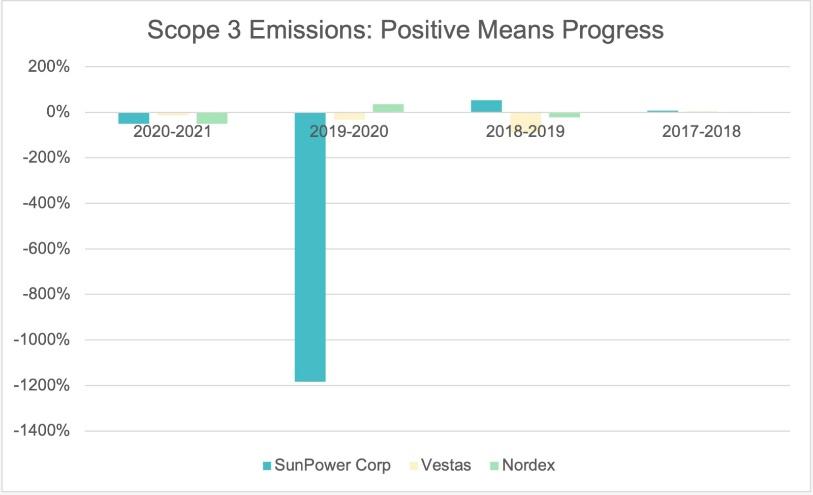
The story becomes even more pronounced as we move to scopes 2 and 3, which are the indirect emissions and emissions from their supply chain. Scope 3 emissions are particularly concerning, where with the exception of SunPower Corp in 2018-2019, all other companies in all other time periods are showing negative progress towards reducing their scope 3 emissions. This brings out an important impact channel for the green sector, the supply chain, which is currently being overlooked by investors and regulatory institutions, which should be addressed before it turns into the next wave of greenwashing scandals.
Figure 2a: Scope 1 Emissions Reduction 1
Figure 2b: Scope 2 Emissions Reduction f 1
Figure 2c: Scope 3 Emissions Reduction f 1
Brown Sector Net Zero Benchmarking Case
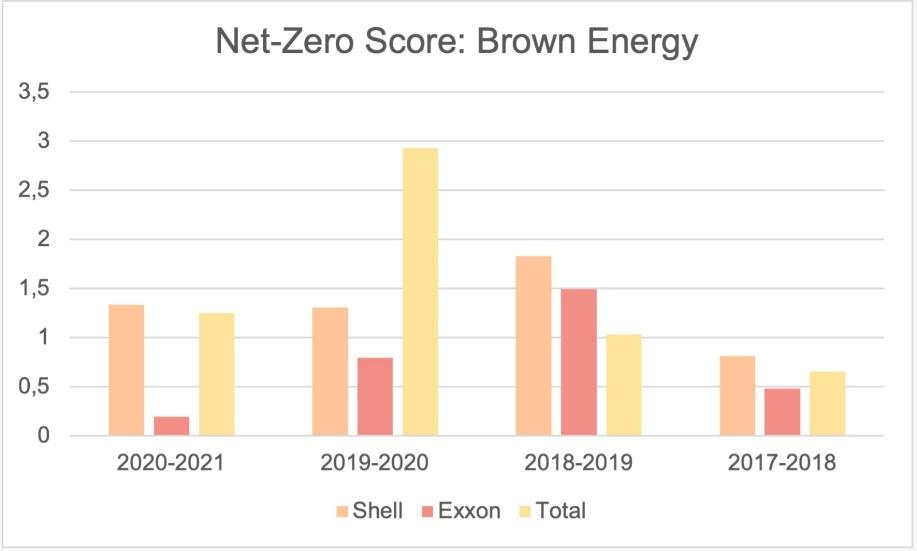
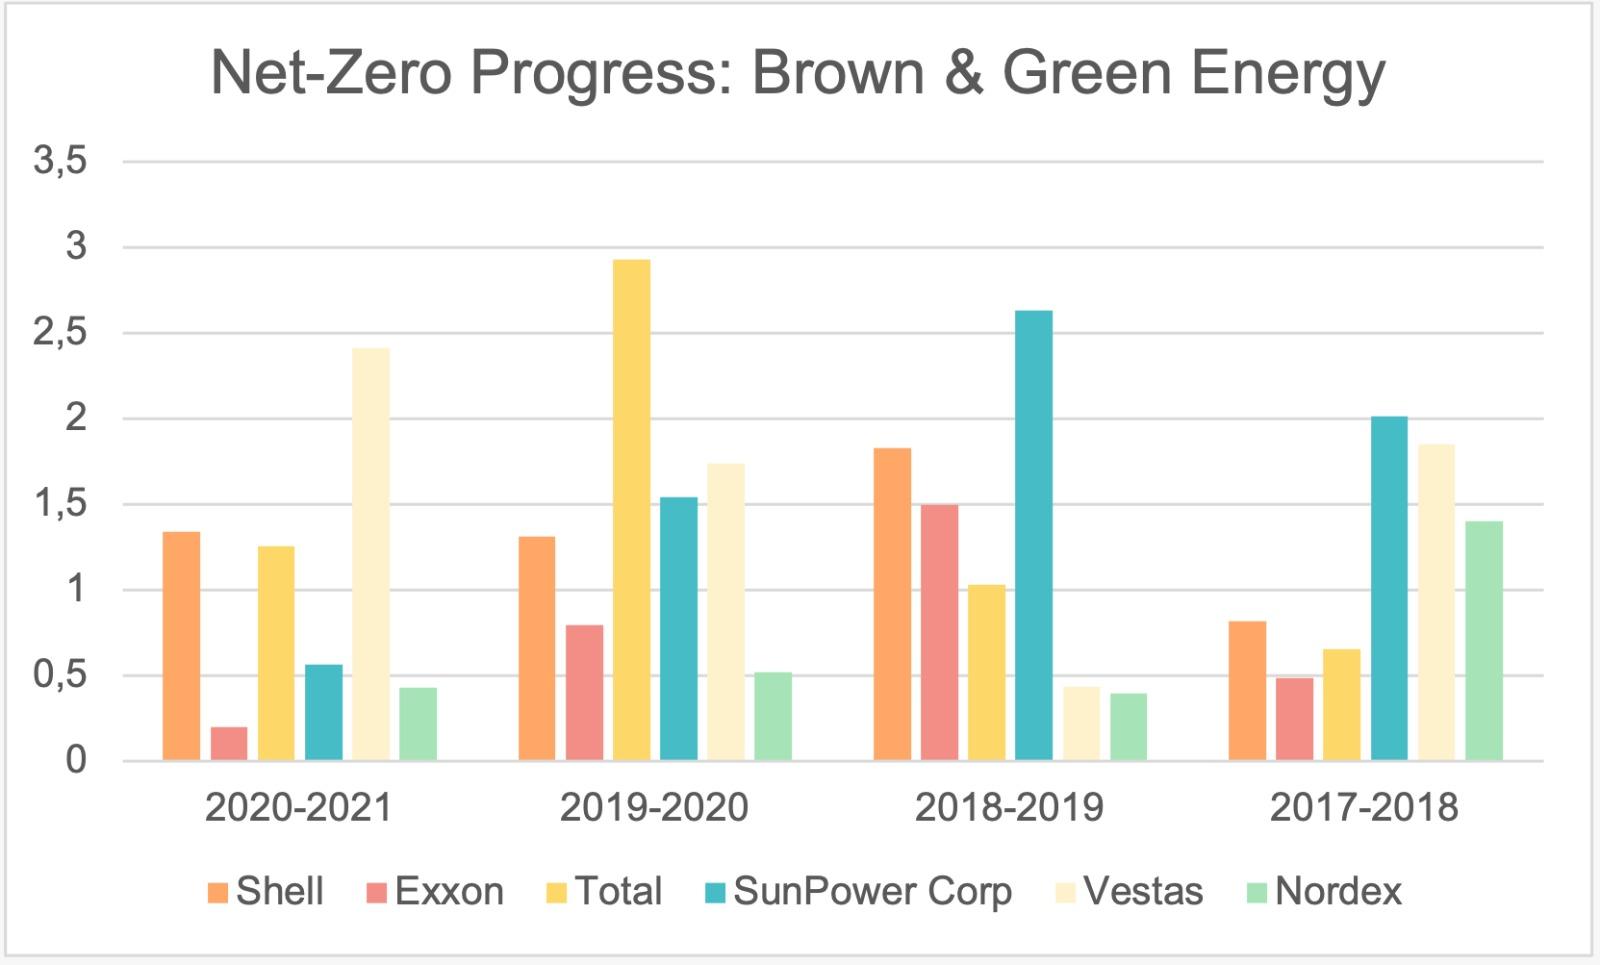
The brown sector, here represented by three companies in the Oil & Gas industry, also indicates variation in the companies’ progress towards reaching net-zero targets. Exxon stands out as a slacker with the exception of the 2018-2019 period in which it has overperformed Total, while Shell overperforms the rest for all years, other than 2019-2020, with Total leading the progress benchmark.
Figure 3: Net-zero progress score for Oil & Gas Companies: Shell, Exxon & Total
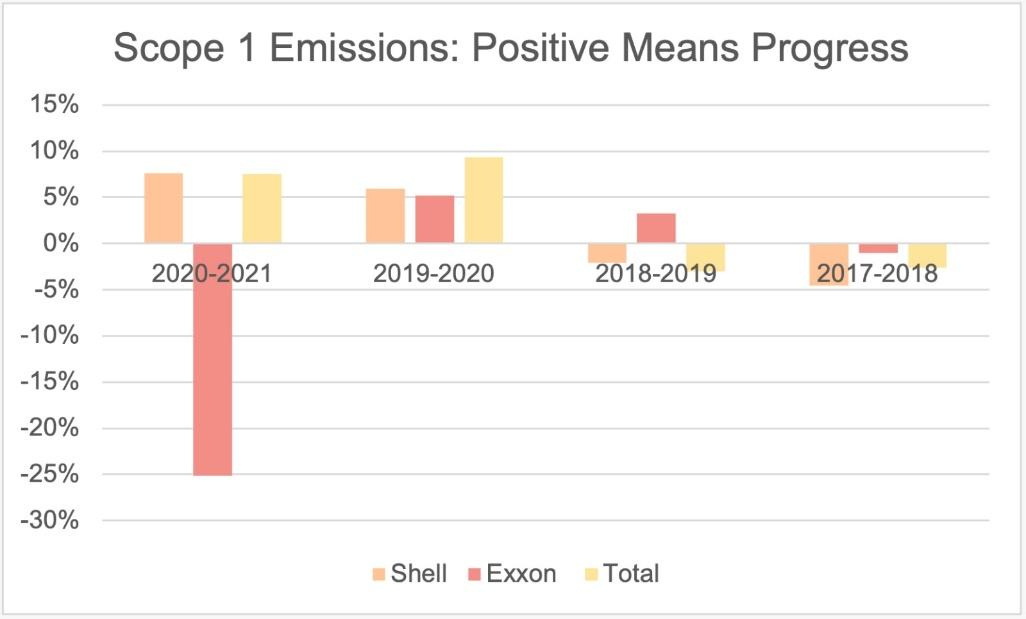
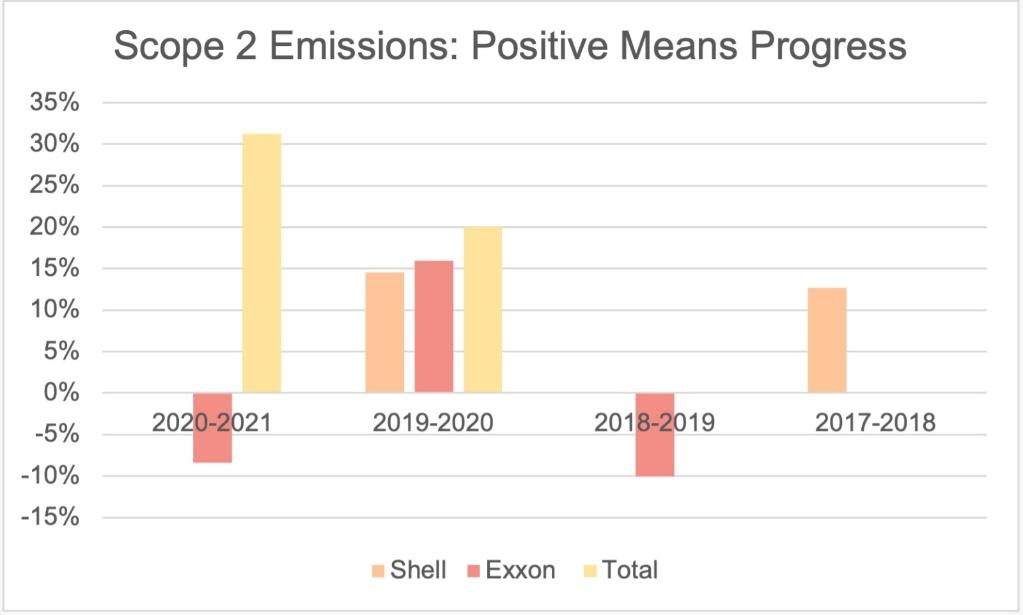
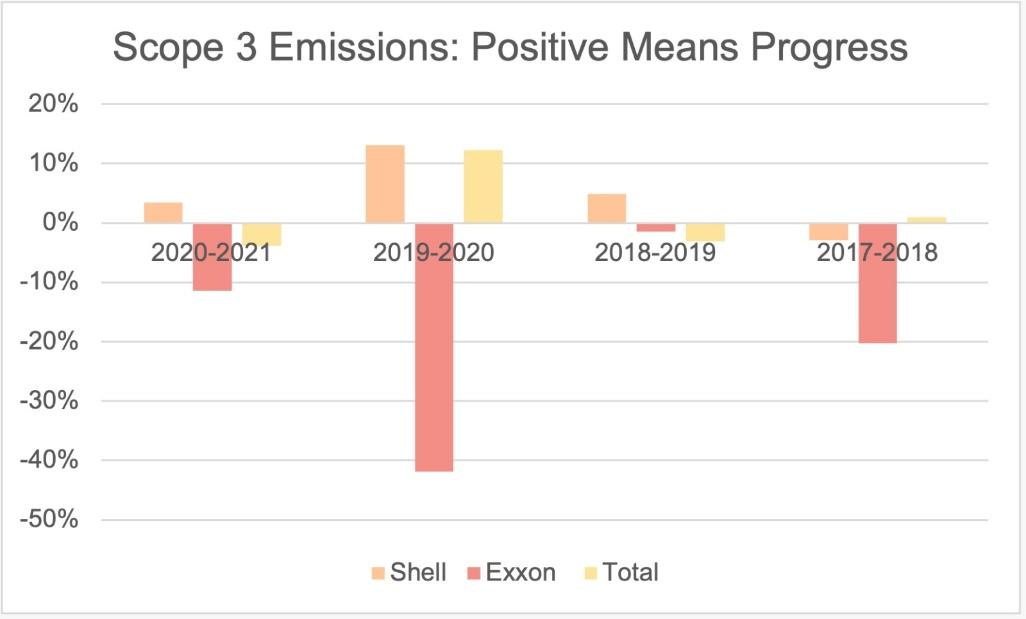
When we dig deeper into their emission reduction levels, we notice that different from the green sector, the Brown sector companies show gradual and significant progress towards reducing their emissions, in line with the Cohen, Gurun and Nguyen (2022) study. Specifically, with the exception of Exxon, all companies in Figure 4b are reducing their scope 2 emissions across 2017-2021. Scope 1 direct emissions are also all gradually reduced for both Shell and Total starting from 2019 and forwards. Exxon on the other hand, starts with progress and follows with a sharp increase for 2020-2021, which explains the greenwashing scandals around it. Regardless, from Figure 4 a, b and c, we understand that not all brown companies are the same and some of them, such as Shell and Total, have indeed shown gradual progress towards addressing their net-zero targets.
Figure 4a: Scope 1 Emissions Reduction for Shell, Exxon & Total
Figure 4b: Scope 2 Emissions Reduction for Shell, Exxon and Total
Figure 4c: Scope 3 Emissions Reduction for Shell Exxon and Total
Investing using a Net-Zero Progress Best-in-Class Strategy
For the rest of this study, let us consider how an investor building net-zero aligned portfolios can use our net-zero progress scores and analytics. Considering the sample of the three green and the three brown companies that we presented above; Figure 5 below ranks each of their progress on every respective time period from 2017-2021.
Figure 5: Net-zero progress benchmarking by period for both Green & Brown Companies
Shell as a second top performer.
With the exception of 2019-2020, Shell is measured to be the top performer for the last half decade within its sub-industry. In the last period 2020-2021, Shell follows Vestas as best-in-class for the energy sector. An investor choosing a green and a brown company to include in its portfolio, would likely choose Shell and Vestas, using a Best-in-Class strategy. When picking one of the two, our granular benchmarking solutions help the investor make a data-informed decision.
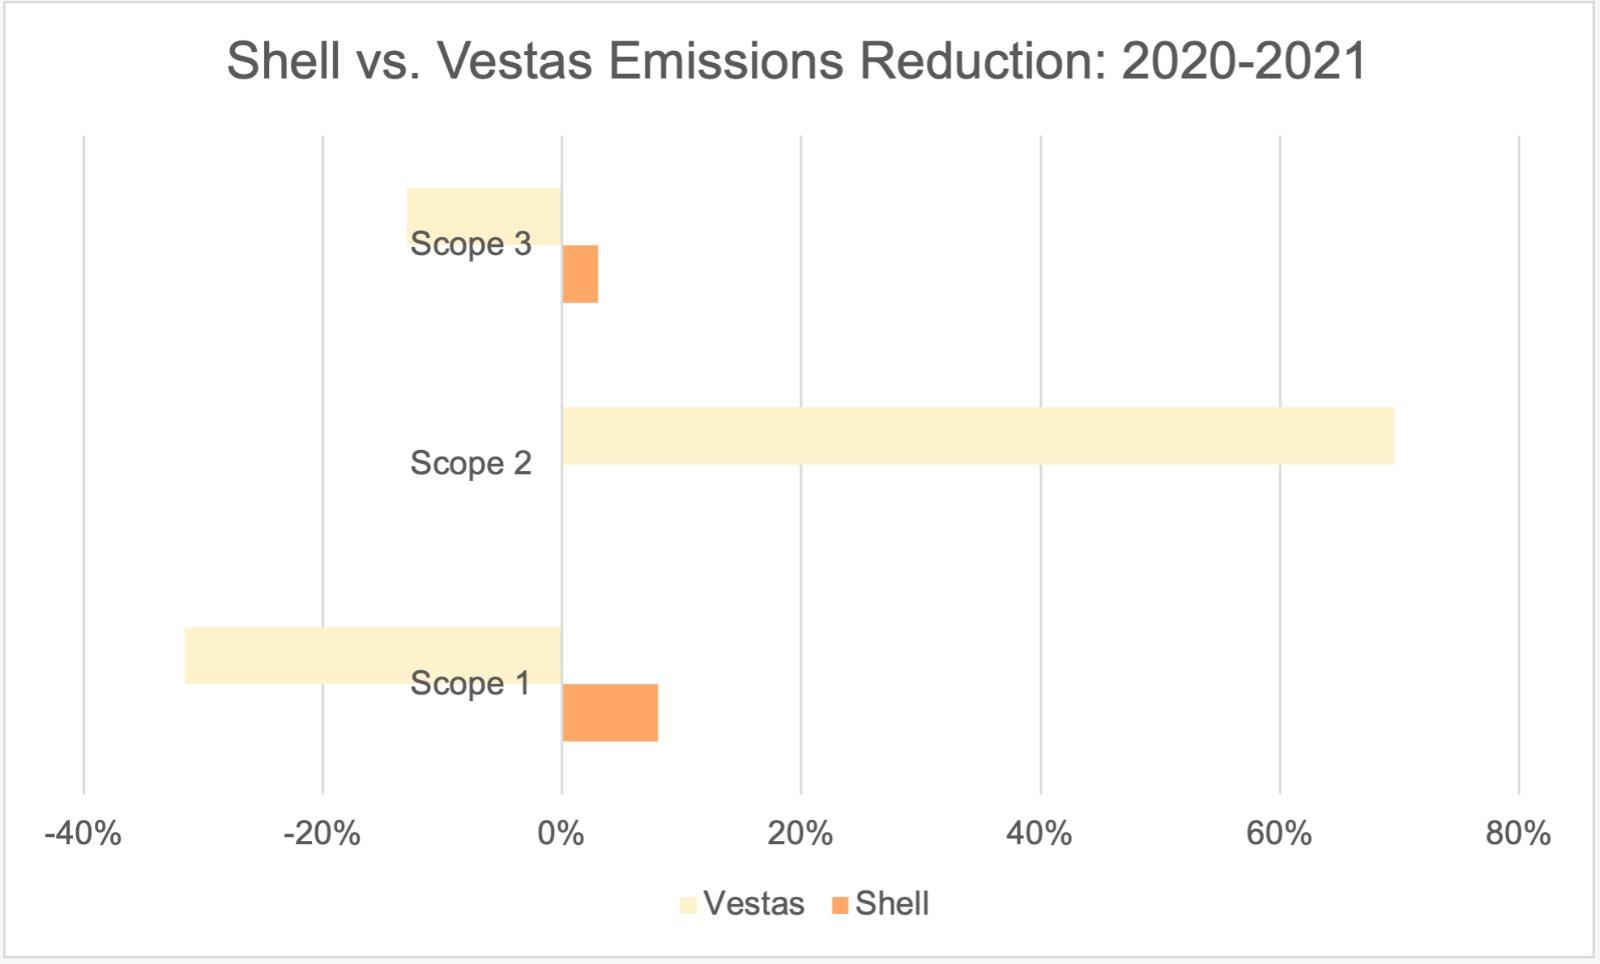
Going on a deeper dive, the investor can use our progress data to identify the exact Scope 1, 2 and 3 emissions reduction for both Shell and Vestas. The results are as shown in Figure 6 below, which explains that the large progress score of Vestas is attributed to its large reduction of scope 2 emissions, while controversially, it is simultaneously increasing its scope 1 and 3 emissions significantly. Shell on the other hand, although it is reducing its emissions more gradually and by smaller change components, it is displaying a more uniform strategy over time at doing so and across all scopes. The investor that internalises the full progress history at both the aggregate and granular levels, would most likely add Shell to its net-zero portfolio.
In terms of emissions levels, we found that our initial assumption is being enforced even further. Specifically, we identified that from 2020-2021, Vestas overall emissions increased by 1,200,000 metric tons of CO2e, while Shell’s decreased by 45,440,000 metric tons of CO2e. To go back to where we started, small but gradual progress towards emissions reduction within the brown sector indeed gets us closer to meeting net-zero transition targets.
Figure 6: Deep-Dive into Shell’s and Vestas’ Emissions Reduction for 2020-2021. Positive means reduction.

