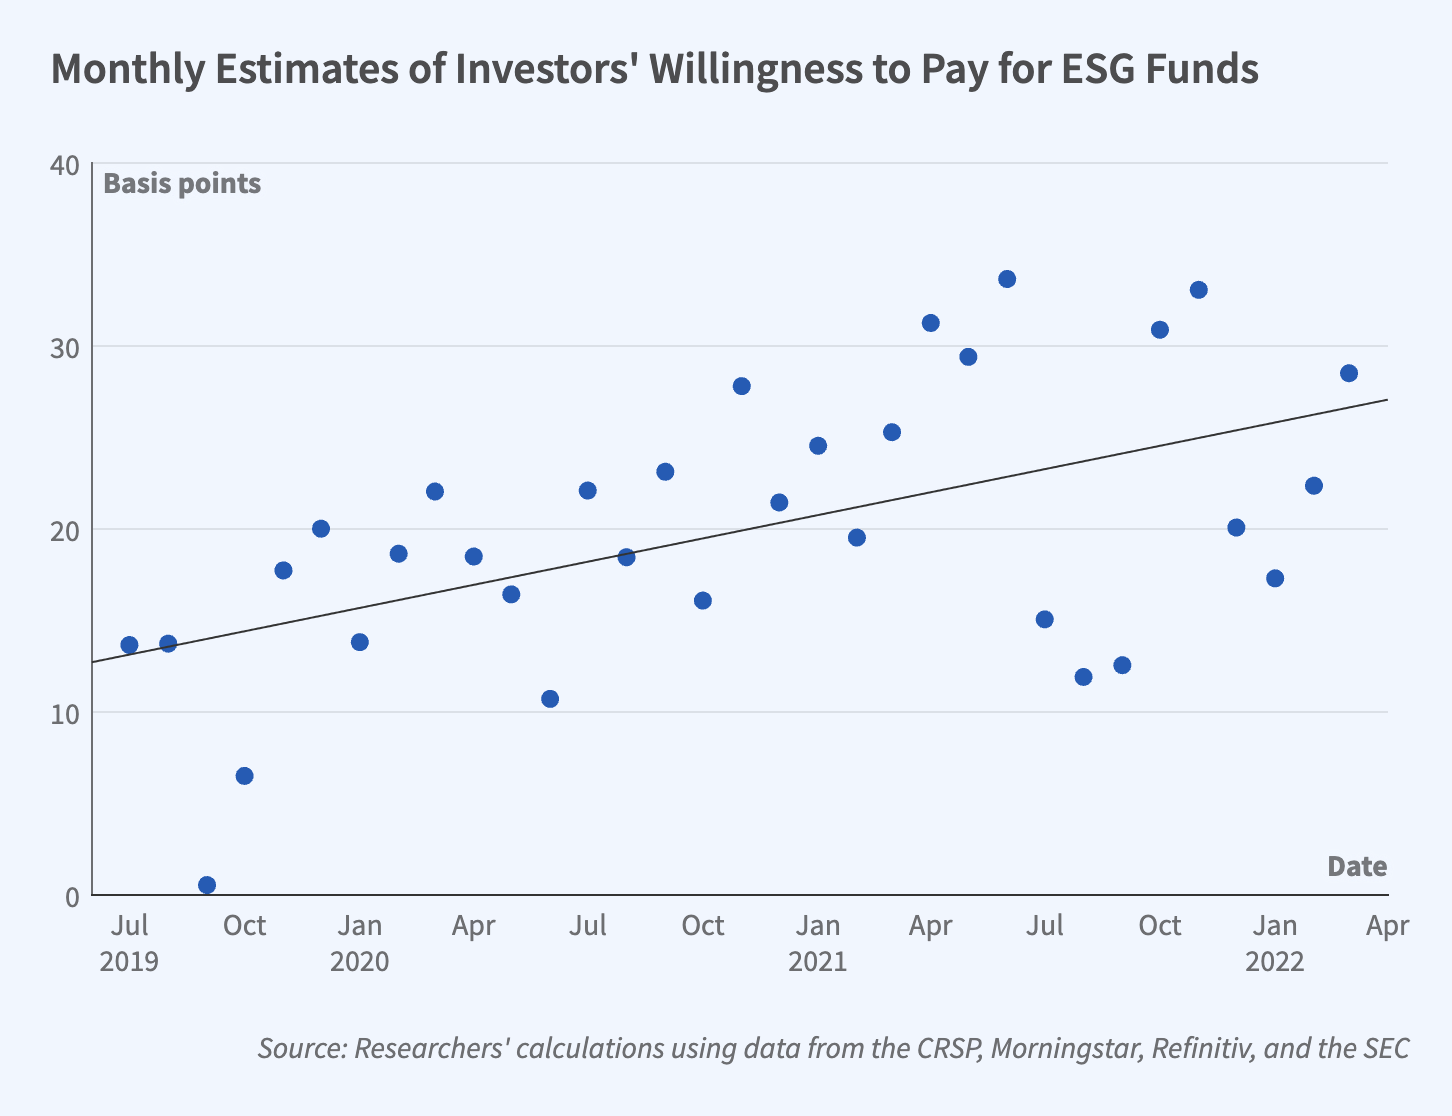
	 	 ESG integration in stock investing was misused and overpromised. The main reason why asset managers care about integrating ESG factors into their investment models was because it made business sense. First, it helped them charge higher fees (refer to Figure 1) to their clients for managing their assets through the ESG lens and second, because trivially poor sustainability practices were making investments riskier.

Figure 1: Source: NBER Working Paper
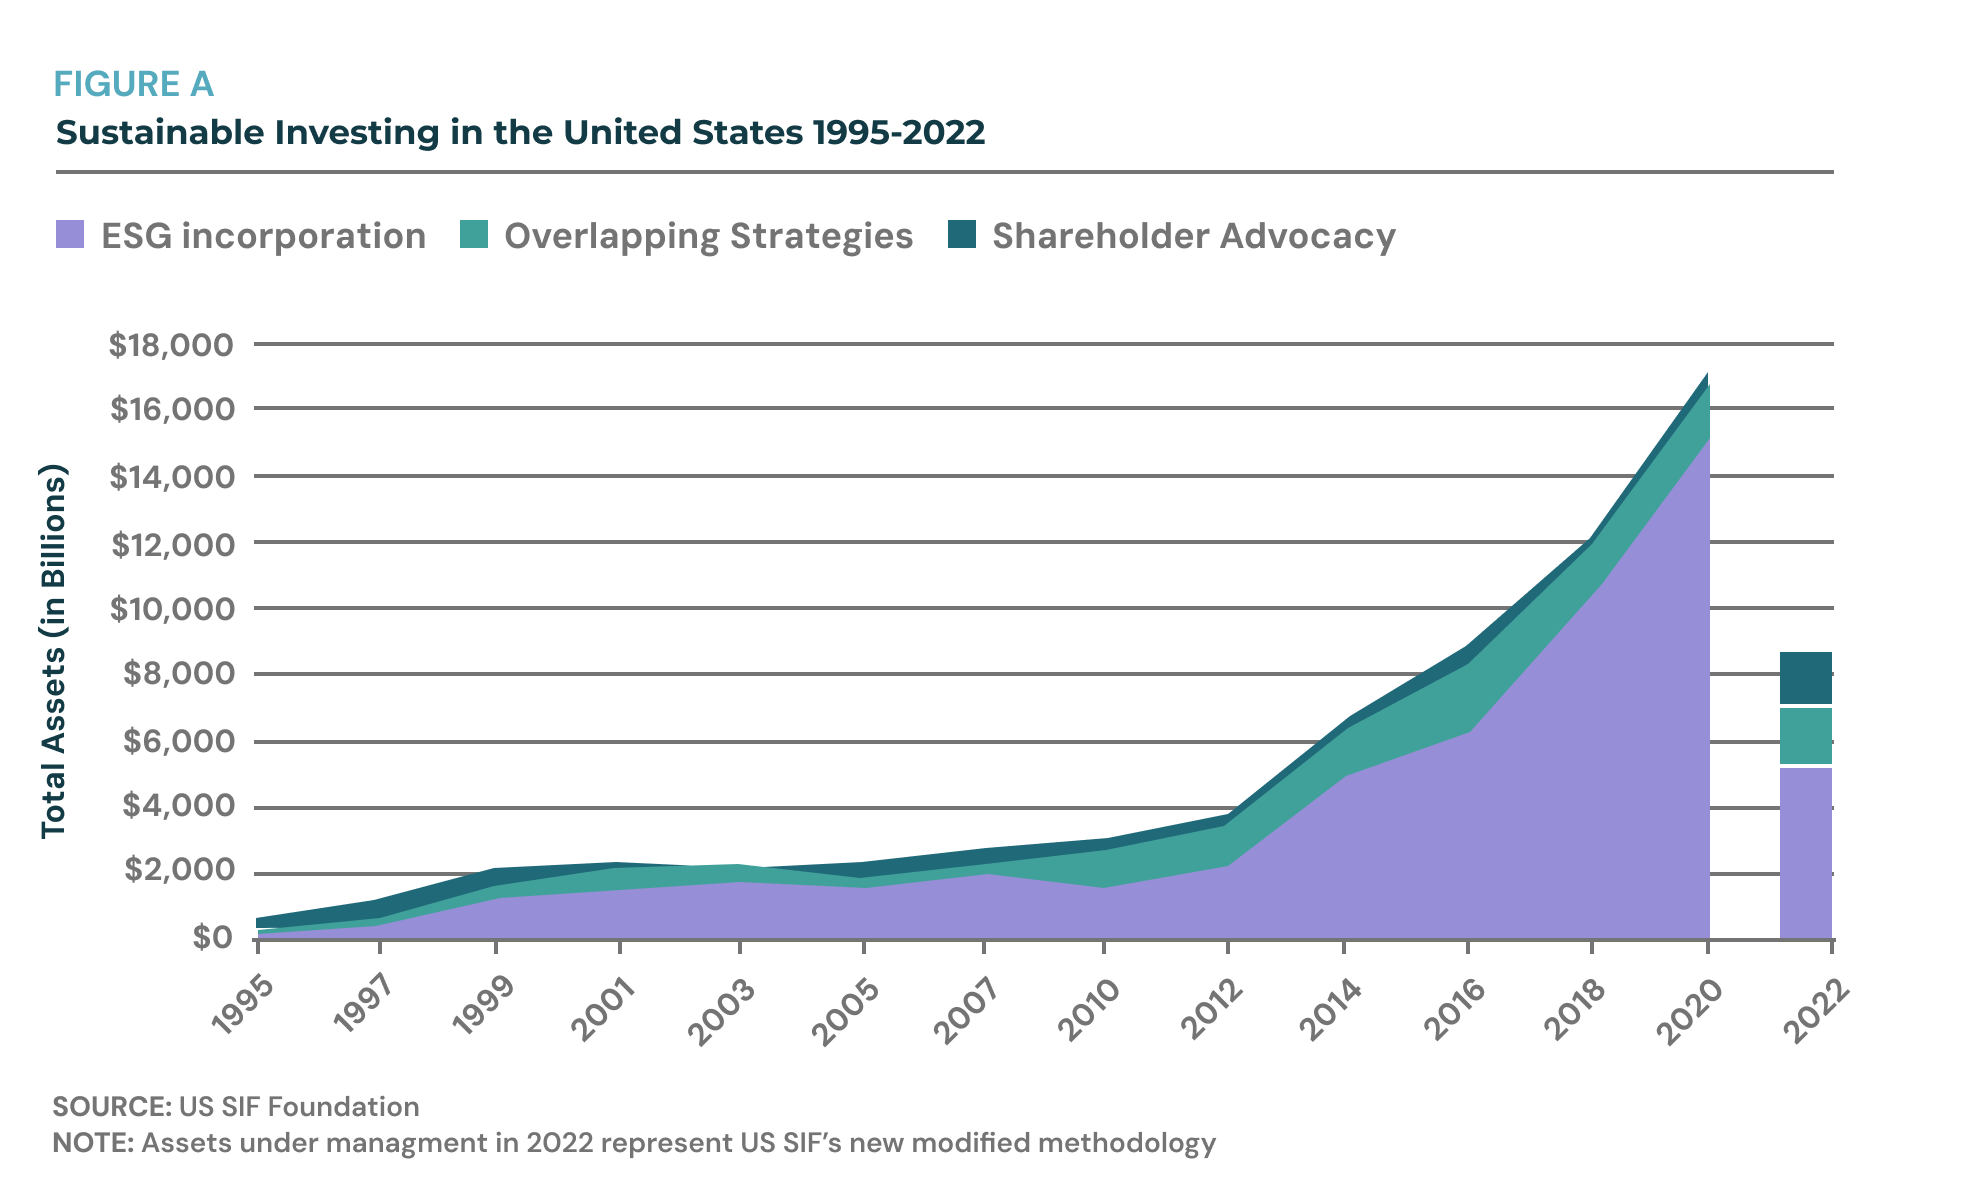
2022 was a turbulent time for ESG funds, where following a series of greenwashing accusations, tightening regulations and increased probability of near-future fines, thousands of passive funds closed, wiping out 8 trillion in ESG assets from the market (refer to Figure 2).

Figure 2: Source: US SIF
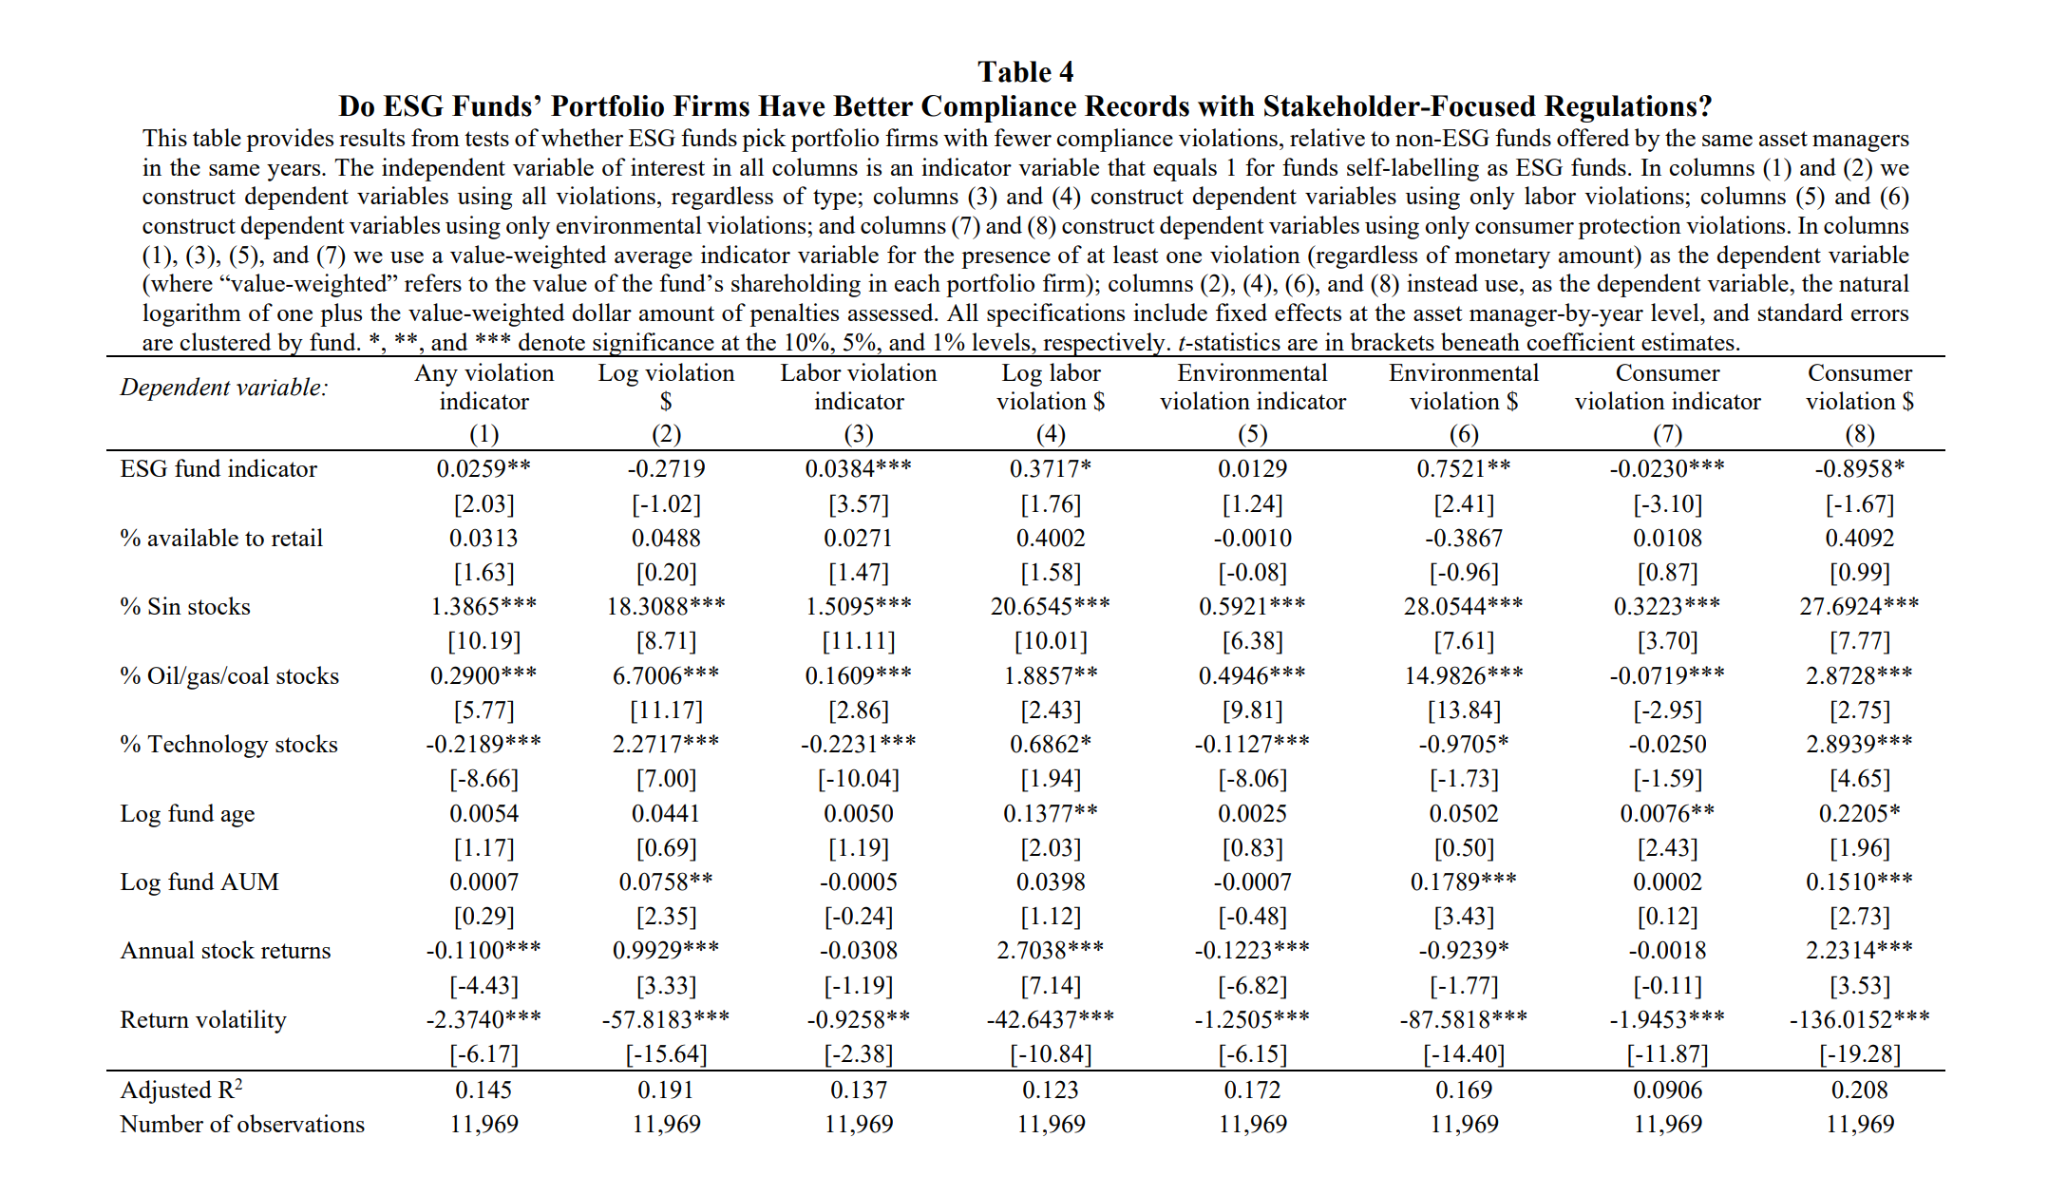
Academic studies also showed that while ESG funds charged higher fees, they did not actually deliver better impact or better returns. Specifically, Raghunandan, Aneesh and Rajgopal, Shivaram (2022), published in the Review of Accounting Studies, studying a sample of over 2000 self-labeled ESG funds and over 30,000 non-ESG funds, found that self-labeled ESG funds funds had holdings of companies that were associated with a higher number of Environmental and Social violations as shown in Figure 3 below.

Figure 3: Source: Raghunandan, Aneesh and Rajgopal, Shivaram (2022)
Additionally, University of Chicago researchers analyzed the Morningstar sustainability ratings of more than 20,000 mutual funds representing over $8 trillion of investor savings. The study published in the Journal of Finance, found that although the highest sustainability-rated funds attracted more capital than the lowest rated funds, the high sustainability-rated funds did not significantly outperform the low-sustainability rated funds.
Observing how ESG & sustainability-rated funds fail to deliver on both fronts, impact and financial performance, we realized that while investors still perceive ESG factors to be fundamental to stock investing now and in the future, the market still lacks consistent ESG metrics that can help asset managers to build high-impact funds that deliver high returns.
Based on our own research and the direct feedback of asset managers, the ConsciESG scoring model successfully brings the only objective, fully-quantitative and historically consistent ESG scores, that assess the realized progress of companies to their stated targets. The results in Table 1 show that when we tested our scores on a sample of 430 public companies traded in the NYSE, we found that the sample of companies that were top rated (Nova) by our methodology in 2021, based on their realized progress to their Scope 1 GHG Emissions targets, jointly reduced their Scope 1 GHG emissions by -3.7 million metric tons  between 2020-2021 alone. These companies were also found to deliver higher returns, compared to the S&P 500 returns as benchmarks.  Table 1 also shows that the high-progress performers sample selected by our methodology (i.e. companies whose ConsciESG Nova Score was 27+), also delivered an annualized alpha of 4.6%, when forward-tested using realized monthly returns for S&P500 benchmark and the sample companies, between January 2022 to present (March 2024).  Figure 4 additionally shows the stock return series of the Top Performers sample versus the S&P 500 benchmark.
|
Scope 1 Emissions Reduction 2021-2020 |
-3.7 million metric tons CO2e |
|
Annualized Alpha 2022-2024 |
5.36% |
Table 1: Top Performers by Scope 1 Reduction Sample- Impact & Alpha
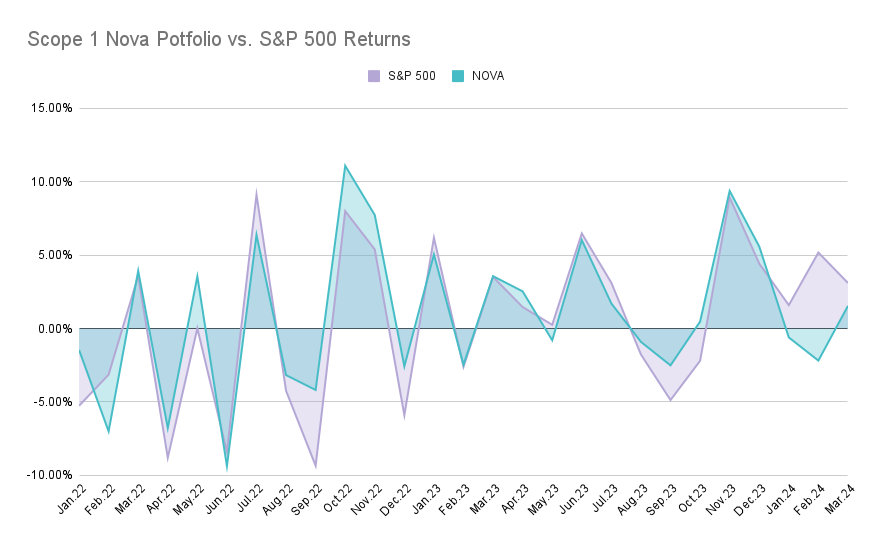
Figure 4: Top Performers sample versus the S&P 500 historical returns.
The model was also tested on the bottom performing companies (i.e. Companies whose ConsciESG Nova Score was <10). As also shown in Table 2 below, we found that the sample of companies that jointly increased their Scope 1 GHG emissions by 9.1 million metric tons between 2020-2021, also delivered an annualized alpha of -1.32%. Figure 5 demonstrates the comparison between the Bottom Performers returns and the S&p 500 benchmark from January 2022 and March 2024.
|
Scope 1 Emissions Reduction 2021-2020 |
+9.1 million metric tons CO2e |
|
Annualized Alpha 2022-2024 |
-1.32% |
Table 2: Bottom Performers by Scope 1 Reduction Sample - Impact & Alpha
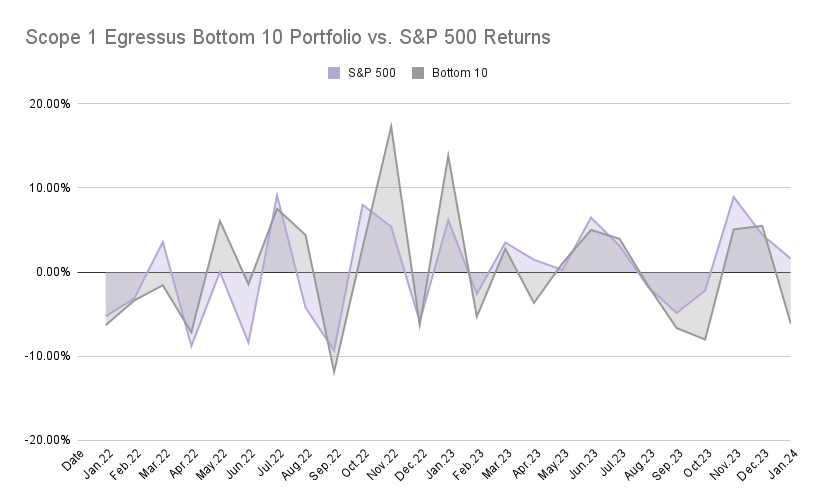
Figure 5: Bottom Performers (Egressus) sample versus the S&P 500 historical returns.
